Documentation Index
Fetch the complete documentation index at: https://docs.sectors.app/llms.txt
Use this file to discover all available pages before exploring further.
Install required libraries
-
Install the requests library to make HTTP Requests
-
Install pandas to do some data exploratory
-
In this recipe we will use altair to do the data visualization, if you are unfamiliar with altair, try to watch this playlist Altair Tutorial
pip install requests pandas altair
Accessing List of All Subsectors
Before writing your code, you must access your API Keys in the Sectors Financial API Page. We will use that API Key later as an authorization for the API.
API_KEYS = "Your API Keys"

headers = {
    "Authorization": API_KEYS
}
response = requests.get("https://api.sectors.app/v2/subsectors/", headers = headers)

if response.status_code == 200:
    data_all_subsectors = response.json()
else:
    # Handle error
    print(response.status_code)
data_all_subsectors you’ll see a list that look like this:
[
 {'sector': 'infrastructures', 'subsector': 'telecommunication'},
 {'sector': 'energy', 'subsector': 'oil-gas-coal'},
 {'sector': 'financials', 'subsector': 'financing-service'},
 {'sector': 'financials', 'subsector': 'investment-service'},
 {'sector': 'consumer-cyclicals', 'subsector': 'apparel-luxury-goods'},
  ...
]
Data Processing
Before doing data visualization, let’s use pandas to perform a little bit of data processing. Begin by converting the list of subsectors to a pandas DataFrame. Since we are going to use only the subsectors data, we can drop the sectors data after making it into a dataframe.
# For your information the response data type is a list
df = pd.DataFrame(data_all_subsectors)
df = df.drop(["sector"], axis=1)
df.head()
| subsector |
|---|
| 0 | telecommunication |
| 1 | oil-gas-coal |
| 2 | financing-service |
| 3 | investment-service |
| 4 | apparel-luxury-goods |
Processing the data
As you can see, the subsector’s naming standard is not user-friendly, let’s fix that too before doing the visualization, you just need to add two lines of code to make it more readable!
df["subsector"] = df["subsector"].str.replace("-"," ")
df["subsector"] = df["subsector"].str.title()
df.head()
| subsector |
|---|
| 0 | Telecommunication |
| 1 | Oil Gas Coal |
| 2 | Financing Service |
| 3 | Investment Service |
| 4 | Apparel Luxury Goods |
Data Visualization
Now let’s try to visualize all the subsectors using altair!
Let’s look at another API
The list of all subSectors Financial API only returns a list of subsectors. This is not terribly insightful, so let’s shift our focus onto another Sectors Financial API that lists all companies within each subsector. That will give us more data to work with and lay the foundation for our data visualization later.
Collect the data
We will join the data from both API to a single list using the code below:
result_data = []
for data in data_all_subsectors:
    subsector_raw = data["subsector"]
    subsector = subsector_raw.replace("-", " ")
    subsector = subsector.title()

    headers = {
    "Authorization": API_KEYS
    }


    response = requests.get(f"https://api.sectors.app/v2/companies/?where=sub_sector='{subsector}'", headers = headers)

    if response.status_code == 200:
        list_companies_by_subsectors = response.json()
        for company in list_companies_by_subsectors.get('results'):
            result_data.append([subsector, company["symbol"]])
    else:
        # Handle error
        print("Error Status :",response.status_code)

print(result_data)
[
 ['telecommunication', 'BALI.JK'],
 ['telecommunication', 'BTEL.JK'],
 ['telecommunication', 'CENT.JK'],
 ['telecommunication', 'DATA.JK'],
 ['telecommunication', 'EXCL.JK'],
 ...
]
Total Companies by Subsector
In this recipe, let’s visualize Total Companies by Subsector using the data that we already have. The first step is to clean our data using the same way and group the data by subsector so we can get the count of companies by each subsector.
df = pd.DataFrame(result_data, columns=["subsectors", "company"])
df["subsectors"] = df["subsectors"].str.replace("-"," ")
df["subsectors"] = df["subsectors"].str.title()
df_grouped = df.groupby('subsectors').size().reset_index(name="total_companies")
| subsectors | total_companies |
|---|
| 0 | Alternative Energy | 2 |
| 1 | Apparel Luxury Goods | 23 |
| 2 | Automobiles Components | 17 |
| 3 | Banks | 47 |
| 4 | Basic Materials | 108 |
Let’s visualize it!
Now let’s do the most basic visualization using altair, beginning with a bar chart to see the number of companies in each subsector.
chart = alt.Chart(df_grouped).mark_bar().encode(
    x='total_companies',
    y=alt.Y('subsectors', sort='-x')
)

chart.display()
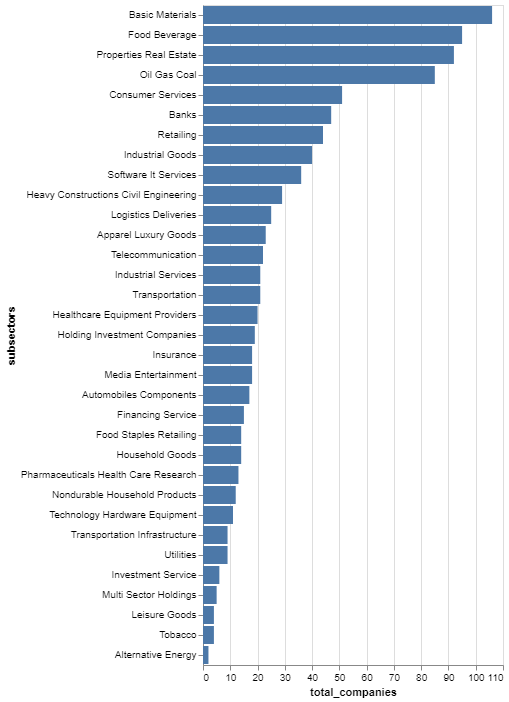 Well now we have done a very basic bar chart visualization using Altair, but it looks really long and messy! Let’s reduce the number to be top 5 biggest subsector by company and do some adjustment on the visualization.
Top 5 Biggest Subsector by Company
df_grouped = df_grouped.sort_values(by="total_companies", ascending=False)
top_five_subsectors = df_grouped.head(5)
A Better visualization!
chart = alt.Chart(top_five_subsectors).mark_bar().encode(
    y=alt.Y("subsectors", sort="-x", title="Subsectors"),
    x=alt.X("total_companies", title="Total Companies"),
    color=alt.Color('subsectors:N', legend=None)  # Optional: remove the legend if it's redundant
).properties(
    title='Number of Companies by Subsector',
    width=600,
    height=300
)

# Configure overall visual theme
chart = chart.configure_title(fontSize=20, anchor='start', color='black').configure_axis(
    labelFontSize=12,
    titleFontSize=14
)

chart.display()
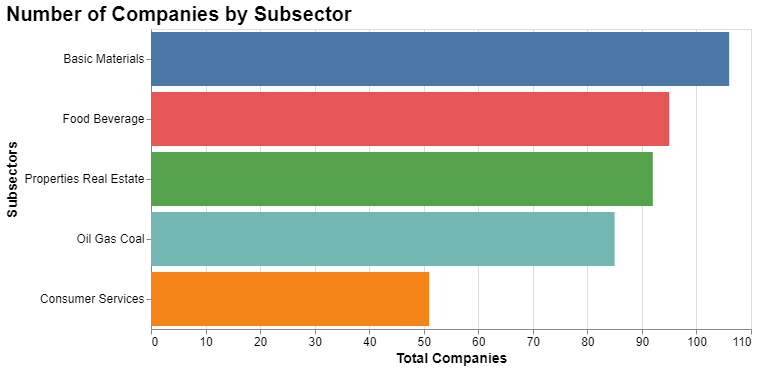 And now we have a much better visualization we can show our boss! 😉
In this recipe, we’ve pulled the data from Sectors and do a little bit data processing and some simple data visualization! Now you can take a look at another API and try to build your own visualization based on your needs or you can simply follow along the rest of this cookbook to see more recipes that you can try!
And now we have a much better visualization we can show our boss! 😉
In this recipe, we’ve pulled the data from Sectors and do a little bit data processing and some simple data visualization! Now you can take a look at another API and try to build your own visualization based on your needs or you can simply follow along the rest of this cookbook to see more recipes that you can try!