Documentation Index
Fetch the complete documentation index at: https://docs.sectors.app/llms.txt
Use this file to discover all available pages before exploring further.
Stock price data provides a valuable time series that allows us to analyze price fluctuations over specific time intervals. From descriptive analytics to predictive models, there are various analyses we can perform. In this article, we’ll revisit the basics by examining stock price changes in response to significant events.
The Moving Average and Beyond
Traders often rely on moving averages to understand trends and make informed decisions. If you’re unfamiliar with moving averages, my colleague has covered them in detail in the Simple Moving Average recipe. However, today, we’ll explore a different angle: how stock prices react to specific events.
Visualizing Price Movements
To analyze stock price changes, we’ll create time series plots, assigning distinct colors to each event. This approach makes it easier for users to observe whether stock prices increase or decrease following specific occurrences. Our case study revolves around a recent viral topic in Indonesia: the announcement of Starlink’s operational availability in the country.
The Starlink Impact
While Starlink isn’t a direct competitor to all companies, its presence can indirectly affect related industries. Let’s focus on a few key players:
-
TLKM.JK (Telkom Indonesia): TLKM.JK provides internet services through brands like Indihome and Telkomsel Orbit. How will their stock price react to Starlink’s arrival?
-
EXCL.JK (XL Axiata): EXCL.JK, known for XLHome, faces competition from Starlink. Will their stock price be impacted?
-
ISAT.JK (Indosat Ooredoo): ISAT.JK offers Indosat HIFI services. How will they fare in the wake of Starlink’s announcement?
-
KLBV.JK (First Media): KLBV.JK, associated with FirstMedia, is another player in the field. What changes will they experience?
The Timeline
Our analysis begins with the first rumors of Starlink’s availability in Indonesia on early May 2024. We’ll then examine stock price movements following the official announcement by the Indonesian government and Elon Musk during an event in Bali on May 19, 2024.
Data Fetching
Before diving into data fetching and processing, we’ll start by importing the necessary packages for this recipe. The libraries listed below are the ones we’ll be using. If you haven’t already installed them, make sure to do so before proceeding!
import pandas as pd
import datetime
from datetime import timedelta
import requests

import matplotlib.pyplot as plt
df_daily_hist = pd.DataFrame()

api_key = "CHANGE WITH YOUR OWN API KEY"

def get_date_list(start_date):
    start_date = datetime.datetime.strptime(start_date, '%Y-%m-%d')

    end_date = datetime.datetime.today()

    date_list = []

    while start_date < end_date:
        date_list.append(start_date)
        start_date += timedelta(days=90)

    date_list.append(end_date)

    return date_list

date = get_date_list("2024-04-01")

for i in ["TLKM.JK","ISAT.JK","EXCL.JK","KBLV.JK"]:
    for j in range (0,len(date)-1):
        if j==0:
            start_date = date[j]
            start_date = start_date.strftime('%Y-%m-%d')

            end_date = date[j+1]
            end_date = end_date.strftime('%Y-%m-%d')
        else:
            start_date = date[j]+ timedelta(days=1)
            start_date = start_date.strftime('%Y-%m-%d')

            end_date = date[j+1]
            end_date = end_date.strftime('%Y-%m-%d')

        url = f"https://api.sectors.app/v2/daily/{i}/?start={start_date}&end={end_date}"


        headers = {
            "Authorization": api_key
        }

        response = requests.get(url, headers = headers)

        if response.status_code == 200:
            data = response.json()
        else:
            # Handle error
            print(response.status_code)

        df_daily_hist = pd.concat([df_daily_hist,pd.DataFrame(data)])

        print(f"Finish collect data for stock {i} from {start_date} to {end_date}")
| symbol | date | close | volume | market_cap |
|---|
| TLKM.JK | 2024-04-01 | 3510 | 248116300 | 347708338470912 |
| TLKM.JK | 2024-04-02 | 3490 | 233071700 | 345727083479040 |
| TLKM.JK | 2024-04-03 | 3420 | 1502657000 | 338792724561920 |
| TLKM.JK | 2024-04-04 | 3450 | 205184000 | 348760504795136 |
| TLKM.JK | 2024-04-05 | 3460 | 116057100 | 339783352057856 |
Data Visualization
In our Python series, we’ve explored various plotting libraries, with Altair taking center stage. However, today, we’ll diving into the world of Matplotlib in this recipe. Before you ask, there’s no definitive winner between these two packages—it’s all about personal preference and the results you seek.
Below, you’ll find the code snippet to create a line or time series plot for TLKM.JK using Matplotlib. Feel free to experiment and compare the results!
df_tlkm = df_daily_hist[df_daily_hist.symbol == "TLKM.JK"]

plt.figure(figsize=(14, 10))
plt.plot(df_tlkm['date'], df_tlkm['close'], linewidth=2)

# Formatting the plot
plt.xlabel('Date')
plt.ylabel('Value')
plt.title('TLKM.JK Daily Price Since 1 April 2024')
plt.tight_layout()
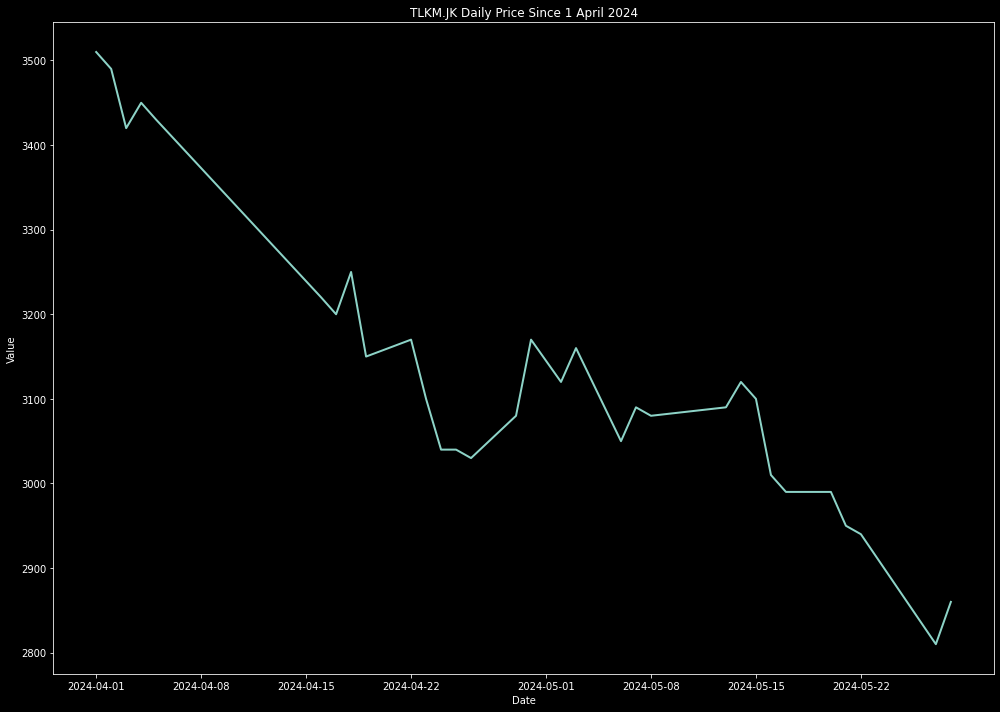 In the plot above, we visualized TLKM.JK’s stock price movement. However, discerning whether the price increased or decreased after the Starlink rumors and official announcement remains challenging. Fear not! We’ll create a more informative plot—one that color-codes the line segments based on significant events.
Our goal is to highlight key moments in TLKM.JK’s journey. By assigning different colors to specific periods, we’ll make trends more apparent. Buckle up as we dive into the code! Below, you’ll find the code snippet to create a line plot with distinct colors for different events. Let’s unveil the hidden insights:
In the plot above, we visualized TLKM.JK’s stock price movement. However, discerning whether the price increased or decreased after the Starlink rumors and official announcement remains challenging. Fear not! We’ll create a more informative plot—one that color-codes the line segments based on significant events.
Our goal is to highlight key moments in TLKM.JK’s journey. By assigning different colors to specific periods, we’ll make trends more apparent. Buckle up as we dive into the code! Below, you’ll find the code snippet to create a line plot with distinct colors for different events. Let’s unveil the hidden insights:
# Convert date to datetime
df_tlkm['date'] = pd.to_datetime(df_tlkm['date'])

# Define the color change dates
yellow_date = pd.Timestamp('2024-05-02')
red_date = pd.Timestamp('2024-05-19')

# Plotting the data with conditional coloring
plt.style.use('dark_background')
plt.figure(figsize=(14, 10))

# Plot each segment with the appropriate color
for i in range(len(df_tlkm) - 1):
    start_date = df_tlkm['date'].iloc[i]
    end_date = df_tlkm['date'].iloc[i + 1]
    if end_date > red_date:
        color = 'red'
    elif end_date > yellow_date:
        color = 'yellow'
    else:
        color = 'white'

    plt.plot(df_tlkm['date'].iloc[i:i+2], df_tlkm['close'].iloc[i:i+2], color=color, linewidth=2)

# Formatting the plot
plt.xlabel('Date')
plt.ylabel('Value')
plt.title('TLKM.JK Daily Price Since 1 April 2024')
plt.tight_layout()

# Create custom legend
import matplotlib.lines as mlines

blue_line = mlines.Line2D([], [], color='white', linewidth=2, label='Before Starlink Rumours')
yellow_line = mlines.Line2D([], [], color='yellow', linewidth=2, label="After First Starlink's Rumour News Emerged")
red_line = mlines.Line2D([], [], color='red', linewidth=2, label='After Starlink Official Announcement in Indonesia')

plt.legend(handles=[blue_line, yellow_line, red_line])

# Show the plot
plt.show()
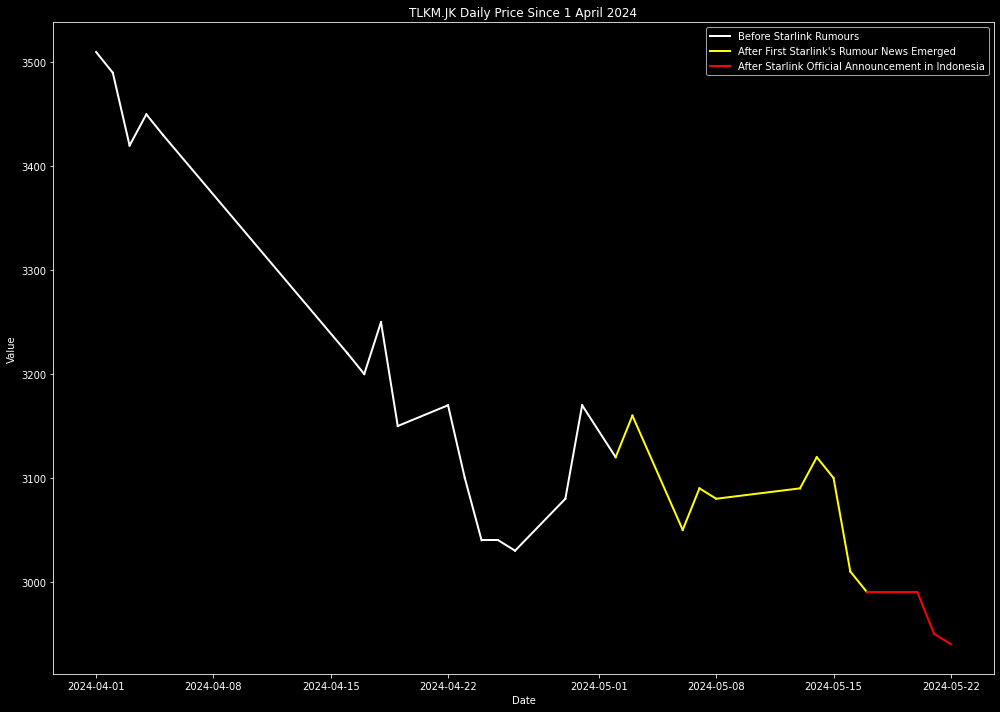 In the previous plot, we directly observed TLKM.JK’s price movements following specific events related to Starlink’s announcement. Armed with this information, you can conduct your analysis and make informed trading decisions. But why stop there? Extend this approach to other companies mentioned earlier or explore different events for further insights.
Therefore, don’t forget to subscribe to the Sectors Financial API to open more possibility of analysis using the data and endpoints that Sectors have! Remember, the stock market is a dynamic arena, and every plot tells a story. Happy analyzing!
In the previous plot, we directly observed TLKM.JK’s price movements following specific events related to Starlink’s announcement. Armed with this information, you can conduct your analysis and make informed trading decisions. But why stop there? Extend this approach to other companies mentioned earlier or explore different events for further insights.
Therefore, don’t forget to subscribe to the Sectors Financial API to open more possibility of analysis using the data and endpoints that Sectors have! Remember, the stock market is a dynamic arena, and every plot tells a story. Happy analyzing!