The Sectors API v2 introduces a natural language query feature for the company screener endpoint. A single query like “top 5 banks by market cap” returns a ranked list of matching companies — but a list of tickers and names alone tells you little about why each company is worth looking at. The naive solution is to take those results and manually call additional endpoints for each company — one for valuation metrics, one for revenue breakdown — then stitch all the data together before feeding it to an AI. For five companies and two enrichment endpoints, that’s ten sequential API calls, manual data merging, and custom scripting. It’s the kind of task that’s tedious to write, fragile to maintain, and impossible to hand off to a non-developer. This is where n8n earns its place. In this guide, you’ll build a workflow that does all of that automatically: it screens companies via natural language, fans out to enrich each result in parallel across two API endpoints simultaneously, merges and aggregates the enriched data, and passes it to an AI analyst — all in a visual pipeline that runs on demand through a chat interface. What would otherwise be a multi-step script becomes a reusable, modifiable workflow that any team member can inspect and trigger.Documentation Index
Fetch the complete documentation index at: https://docs.sectors.app/llms.txt
Use this file to discover all available pages before exploring further.
Overview
In this recipe, you will learn how to:- Use the Sectors V2 Company Screener API with natural language queries
- Fan out screener results into per-company enrichment calls using n8n’s Split Out node
- Fetch company overview, valuation, and revenue breakdown data in parallel branches
- Recombine enriched data using the Merge and Aggregate nodes
- Build a structured prompt from multi-source API data using a Code node
- Pass the prompt to an AI Agent (Claude, OpenAI, Groq, or any supported model) that writes a readable analysis
Understanding the Pattern: From Screener to Analysis
The screener endpoint is powerful for discovery — it tells you which companies match a query. But it only returns a symbol and a company name. To answer why those companies are interesting, you need to call additional endpoints for each result. This workflow introduces three n8n patterns that make multi-source data collection practical:- Split Out: Takes a list returned by an API and turns each item into an independent work unit. After this node, downstream nodes run once per company automatically — no manual looping required.
- Parallel branches: Once items are split, two HTTP Request nodes run simultaneously for each company — one fetching valuation metrics, one fetching revenue breakdown. This halves the time it would take to fetch both sequentially.
- Merge and Aggregate: The Merge node waits for both branches to complete and pairs their results back together by position. Aggregate then collects all company objects into a single list ready for the AI step.
Prerequisites
Before you start, make sure you have:- A Sectors account on the Standard or Professional plan — sign up at sectors.app
- A Sectors API key — found under API → API Keys in your account
- An API key for your preferred LLM — this guide uses Claude (from console.anthropic.com), but n8n’s AI Agent node supports OpenAI, Groq, Gemini, and others. Any compatible chat model sub-node will work.
- An n8n instance — either n8n Cloud or self-hosted
- Familiarity with n8n basics — see the previous guide if you’re new to n8n
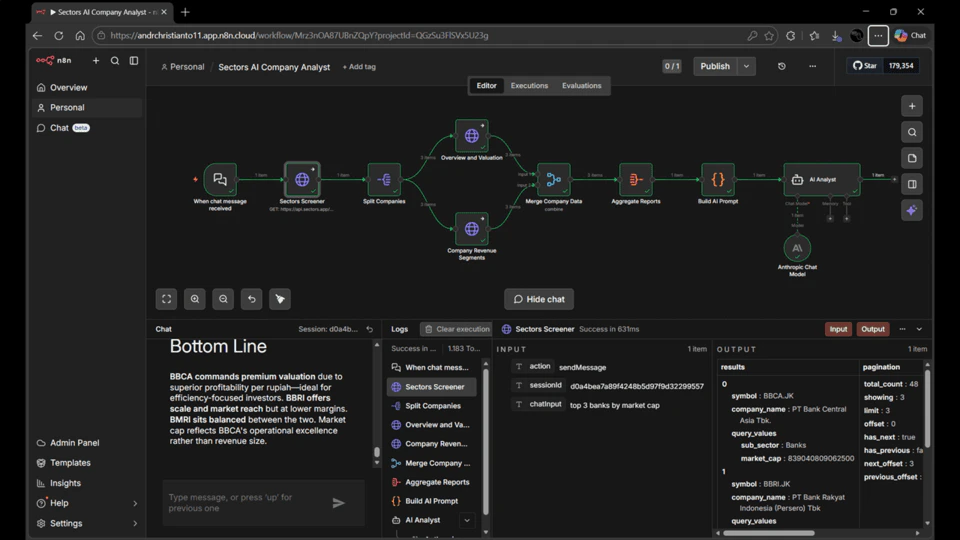
Workflow 3 — AI-Powered Stock Analyst Chatbot
This workflow creates a chat interface that accepts natural language stock queries, enriches each result with data from multiple Sectors API endpoints, and returns an AI-written analysis.Workflow Components
This workflow uses ten nodes across four stages:-
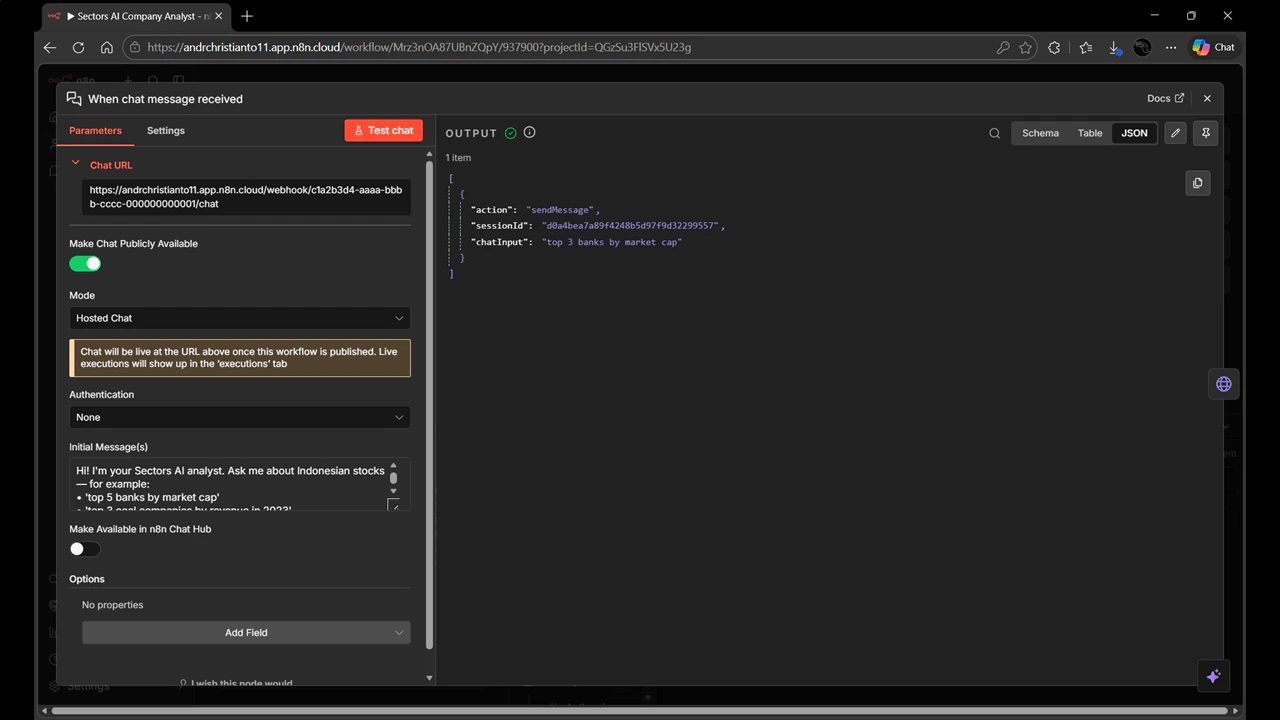
When chat message received — A Chat Trigger node that creates a publicly accessible chat interface. It captures each user message and passes it downstream as
chatInput. This is the entry point for every query. -
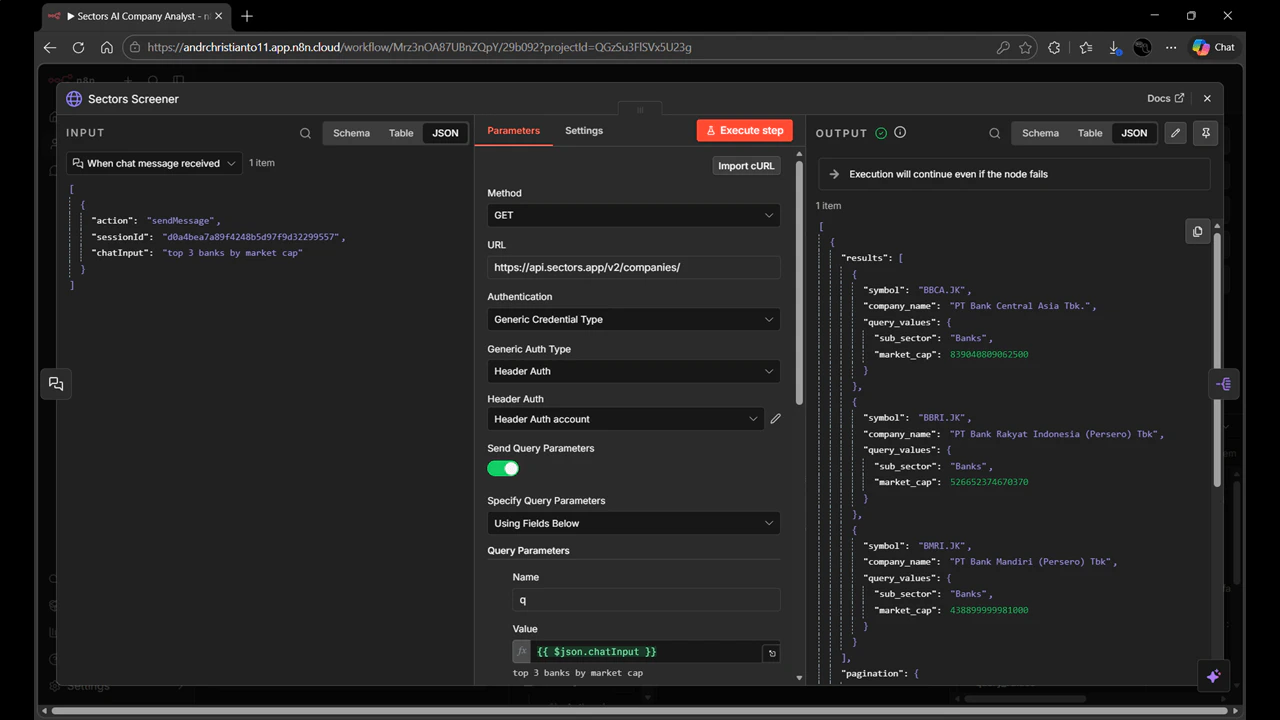
Sectors Screener — An HTTP Request node that calls the v2 NLQ screener endpoint with the user’s message as the
qparameter. The API interprets the natural language query and returns a ranked list of matching companies as aresultsarray. The number of results is controlled by thelimitparameter — set to 5 by default, but adjustable. -
Split Companies — A Split Out node that breaks the
resultsarray into individual items. After this node, each company is processed independently — downstream nodes run once per company rather than once per workflow execution. -
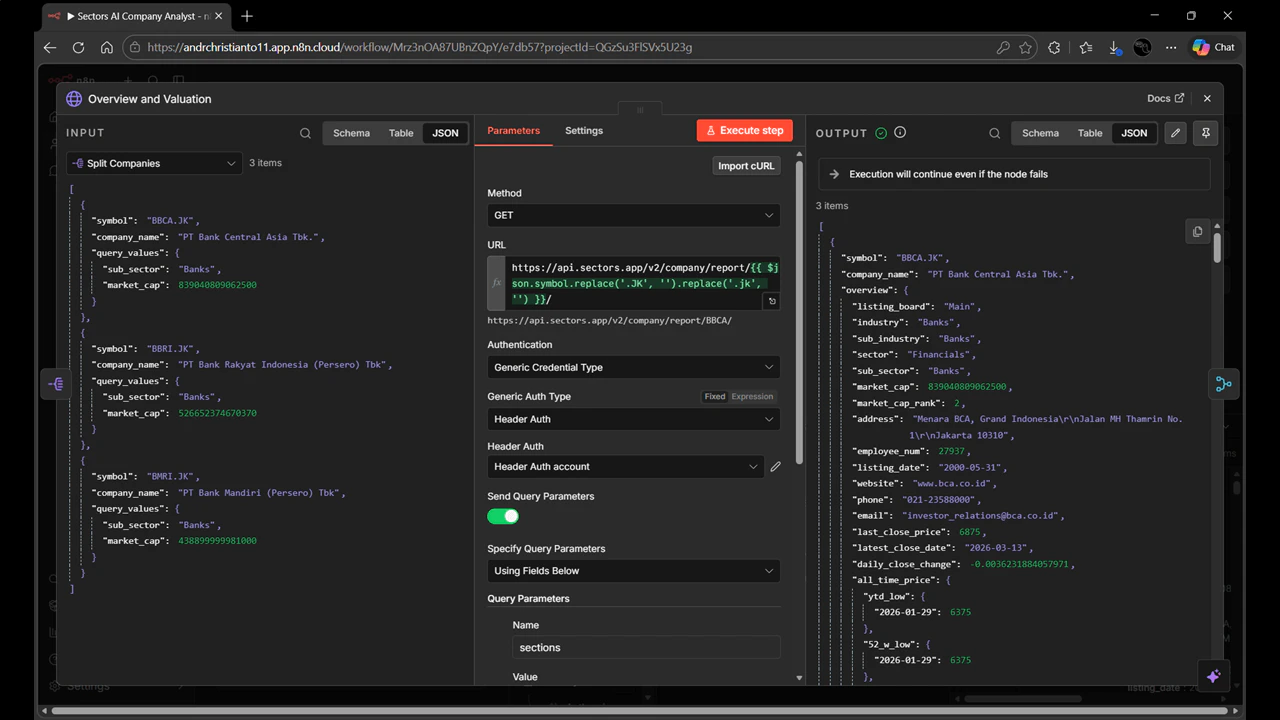
Overview and Valuation (Branch A) — An HTTP Request node that calls the Sectors Company Report endpoint for each company, fetching the
overviewandvaluationsections. This gives us market cap, sector, listing date, P/E, P/B, ROE, and EPS per company. -
Company Revenue Segments (Branch B) — An HTTP Request node that calls the Sectors Revenue Segments endpoint for each company in parallel with Branch A. This returns a
revenue_breakdownarray showing how revenue flows through categories like Net Interest Income, Non-Interest Income, and Operating Income. - Merge Company Data — A Merge node that waits for both Branch A and Branch B to complete, then combines their results by position — pairing the valuation data and revenue breakdown for the same company into a single enriched object.
-
Aggregate Reports — An Aggregate node that collects all enriched company objects into a single item with a
companiesarray. This prepares the data for the AI step, which needs all companies in one context. - Build AI Prompt — A Code node that formats the aggregated company data into a structured prompt string, extracting the key metrics from both API responses and including the original user query as context.
- AI Analyst — An AI Agent node that receives the constructed prompt and generates a written investment-style analysis using the connected language model.
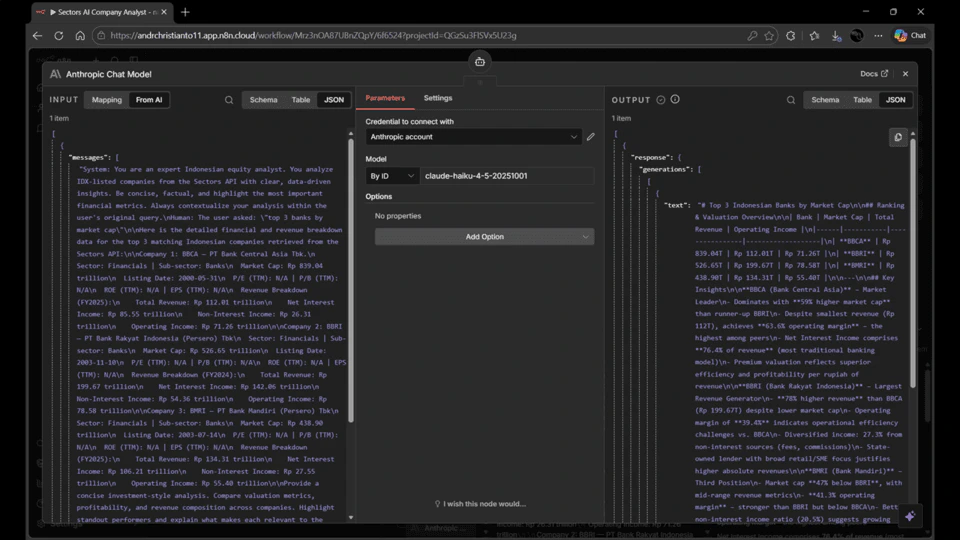
- Chat Model sub-node — A language model sub-node connected to the AI Analyst. This guide uses the Anthropic Chat Model (Claude), but you can swap this for any model n8n supports — OpenAI, Groq, Gemini, and others all work the same way. Sub-nodes in n8n extend agent nodes with capabilities; in this case, the LLM that does the actual text generation.
Stage 1 — Receive and Screen
1. Create a New Workflow with Chat Trigger
- Log into your n8n instance and create a new blank workflow.
- Click “Add first step…” on the canvas.
- Search for “When chat message received” and select it as your trigger.
- In the trigger configuration:
- Toggle “Make Chat Publicly Available” to ON
- In the Initial Message(s) field, enter:
- Copy the Chat URL — you’ll use this to access the chatbot after publishing.
2. Add the Sectors Screener Node
- Click the + button to add a node after the Chat Trigger.
- Search for “HTTP Request” and add it. Name it Sectors Screener.
-
Configure it:
- Method:
GET - URL:
https://api.sectors.app/v2/companies/ - Authentication: Generic Credential Type → Header Auth → select your Sectors API credential
- Method:
-
Toggle “Send Query Parameters” to ON and add three parameters:
Name Value q{{ $json.chatInput }}limit5include_query_valuestrue
q parameter is what activates the natural language query feature. The limit parameter controls how many companies the screener returns — increase it if you want broader results, keeping in mind that each additional company triggers one more API call in each enrichment branch. The expression {{ $json.chatInput }} passes the user’s chat message directly to the API. Setting include_query_values to true returns an llm_translation field in the response showing how the API interpreted the natural language query — useful for debugging.
3. Add the Split Companies Node
The screener returns aresults array containing all matched companies as a single item. To process each company individually, you need to split that array into separate items.
- Add a Split Out node after the Sectors Screener. Name it Split Companies.
- Set Fields To Split Out to
results.
limit to 10 in the screener, everything downstream automatically scales to handle 10 companies with no further changes.
Stage 2 — Parallel Enrichment
This is the core of the workflow. Instead of making one API call per company, you make two in parallel — each fetching a different type of data. Both branches receive the same company symbol from Split Companies and run simultaneously.4. Branch A — Overview and Valuation
- Add an HTTP Request node connected to Split Companies. Name it Overview and Valuation.
-
Configure it:
- Method:
GET - URL:
https://api.sectors.app/v2/company/report/{{ $json.symbol.replace('.JK', '').replace('.jk', '') }}/ - Authentication: Header Auth → your Sectors API credential
- Method:
-
Toggle “Send Query Parameters” to ON and add:
Name Value sectionsoverview,valuation
.JK suffix from the ticker symbol before calling the endpoint. The sections parameter limits the response to only the data we need — company overview (sector, market cap, listing date) and valuation metrics (P/E, P/B, ROE, EPS).
5. Branch B — Company Revenue Segments
- Add a second HTTP Request node — also connected to Split Companies (not to Branch A). Name it Company Revenue Segments.
- Configure it:
- Method:
GET - URL:
https://api.sectors.app/v2/company/get-segments/{{ $json.symbol.replace('.JK', '').replace('.jk', '') }}/ - Authentication: Header Auth → your Sectors API credential
- Method:
- No query parameters needed for this endpoint.
revenue_breakdown array — a detailed breakdown of how revenue flows through categories like Interest Income, Net Interest Income, Non-Interest Income, and Operating Income. This data is what gives the AI analyst context on how each company generates its revenue, not just how much.
To connect both Branch A and Branch B to Split Companies, click the + button on the Split Companies node and draw a connection to each HTTP Request node. Both should originate from the same output port on Split Companies — this is what tells n8n to send each company item down both paths simultaneously.
Stage 3 — Recombine
6. Merge Company Data
Both branches now produce enriched items — but they’re separate streams. The Merge node waits for both to complete and pairs them back together.- Add a Merge node. Name it Merge Company Data.
- Connect Overview and Valuation to its Input 1 and Company Revenue Segments to its Input 2.
- Configure it:
- Mode:
Combine - Combine By:
Position
- Mode:
7. Aggregate Reports
The Merge node outputs one item per company. The Aggregate node collects all of them into a single item so the next stage can process them together.- Add an Aggregate node after Merge. Name it Aggregate Reports.
- Configure it:
- Aggregate:
All Item Data (Into a Single List) - Put Output in Field:
companies
- Aggregate:
companies is an array of all enriched company objects.
Stage 4 — Analyze
8. Build AI Prompt
Before passing data to the AI Agent, you need to format it into a structured, readable prompt. A Code node handles this transformation.- Add a Code node after Aggregate Reports. Name it Build AI Prompt.
- Select JavaScript as the language.
- Replace the default code with the following. It does three things:
- Loops through each company in the aggregated list
- Pulls the relevant metrics from both API responses (overview, valuation, and revenue breakdown)
- Assembles everything into a prompt string that includes the user’s original query as context
- Null checks on valuation fields — fields like P/E and ROE can be absent for some companies, so each is checked explicitly before use. Without this, the AI would receive
nullas a value instead of a cleanN/A. - Revenue segments use source → target pairs — this is how the Sectors revenue segments endpoint structures its data (e.g.
source: 'Interest Income',target: 'Net Interest Income'). The lookup filters on both fields to find the right entry. - The original query is included in the prompt — so the AI understands what was asked and frames its analysis in context, rather than producing a generic company summary.
9. Add the AI Analyst Node
- Add an AI Agent node after Build AI Prompt. Name it AI Analyst.
- Configure it:
- Source for Prompt:
Define below - Prompt (User Message):
={{ $json.prompt }}
- Source for Prompt:
- Under Options, set the System Message to:
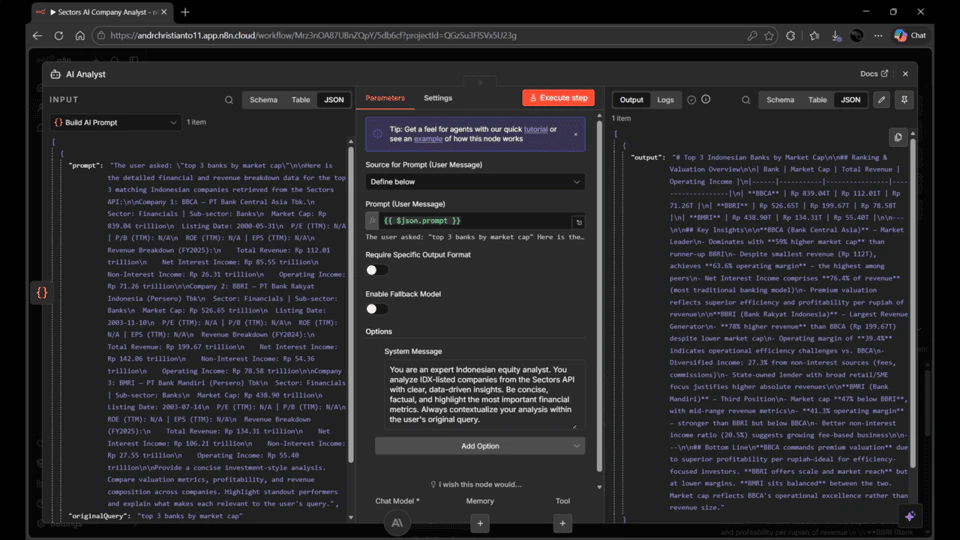
10. Add a Chat Model Sub-Node
The AI Agent node requires a language model to be connected as a sub-node. This guide uses Claude, but the steps are the same for any supported model — just search for the model provider of your choice.- On the AI Analyst node, click the model connection port (the socket at the bottom).
- Search for your preferred model node — e.g. “Anthropic Chat Model”, “OpenAI Chat Model”, or “Groq Chat Model” — and add it.
- Configure it:
- Model: Select your preferred model from the list
- Credential: Create a new credential for your chosen provider and paste your API key
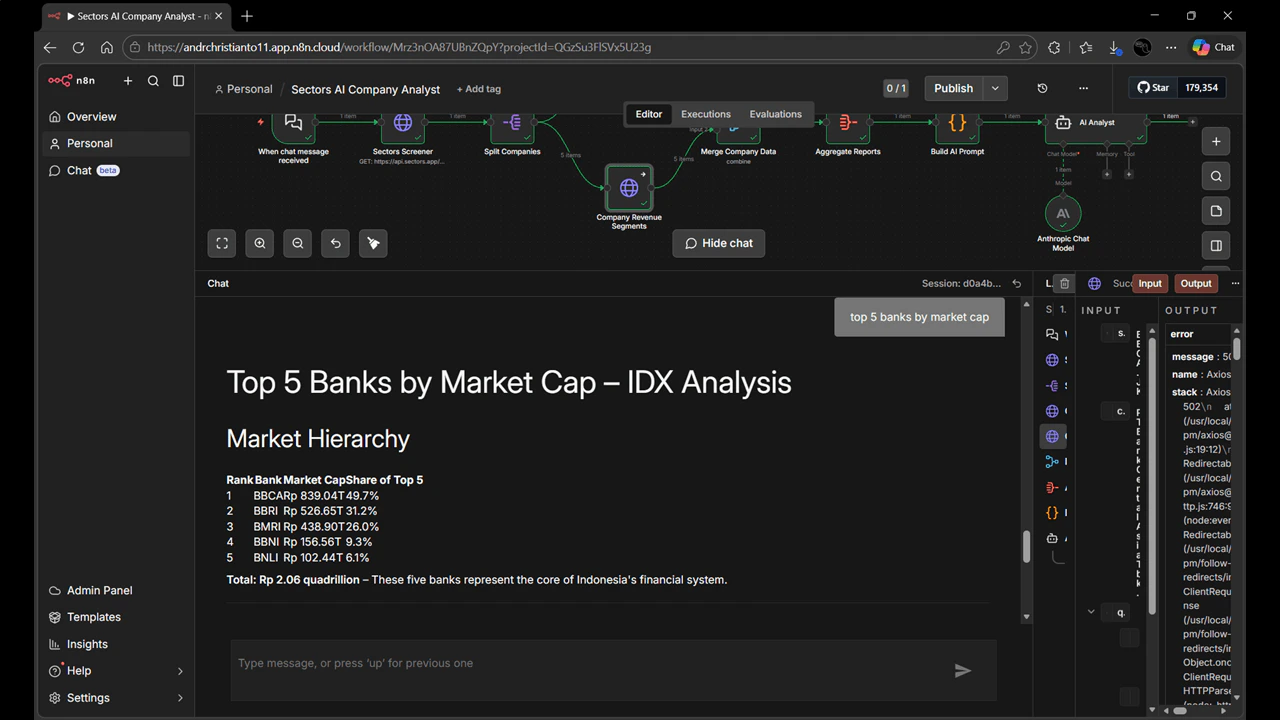
Testing the Workflow
- Save the workflow and click the chat bubble icon at the bottom of the canvas to open the built-in chat panel.
- Type a query and hit send. Each node will light up as it executes.
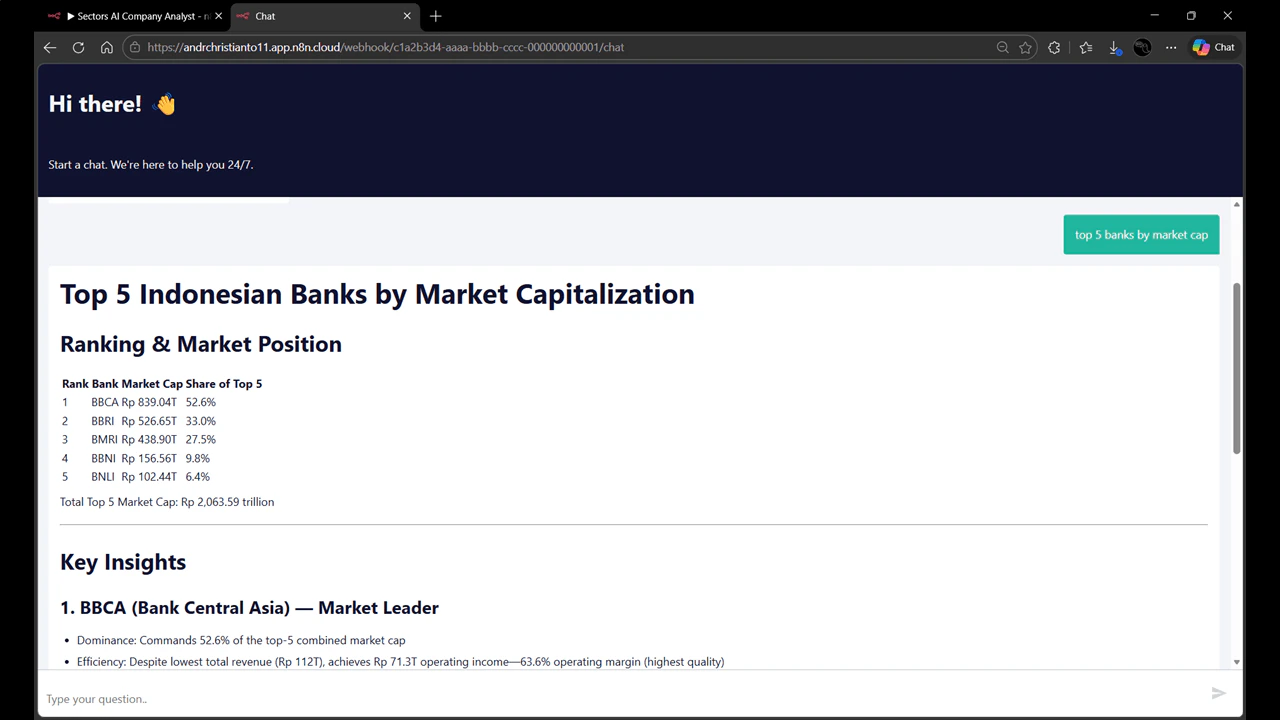
Publishing the Workflow
Once your test passes:- Click Save then Publish in the top-right corner.
- Provide a version name (e.g.
v1.0) and click Publish. - Access the Chat URL you copied in Step 1 — this is the public-facing chatbot interface your users can interact with directly.
- “top 3 coal companies by revenue in 2023”
- “companies in LQ45 sorted by market cap”
- “highest dividend companies in financial sector”
Supported Query Patterns
The NLQ screener interprets natural language and maps it to structured filters. Here are patterns that work well: By index membership:- “top 5 companies in LQ45 by market cap”
- “top 10 companies in IDX30 by revenue”
- “top 3 companies in IDXBUMN30 by market cap”
- “top 5 banks by market cap”
- “top 3 coal mining companies by revenue in 2023”
- “largest technology companies by revenue”
- “companies with highest dividend yield”
- “top 10 companies by market capitalization”
- “top 5 companies with best ROE”
- “top 5 companies by revenue growth in 2023”
- “best performing banks in 2022 by net income”